Current Tables
These current tables are provided in a format that can be helpful in planning kayaking trips. In our part of the world, it is often easier to pass through tight tidal channels during slack water. On the other hand, times of maximal ebb and flood are of interest when seeking out challenging or fun water conditions.
The tables are color-coded by the velocity of the current so it is easy to scan the entire year for days of interest. Times of slack water have a gray background. Times and magnitudes of maximal flood have a colored background related to the velocity. Be aware that these predictions are merely approximate. The timing and magnitude of tidal currents are subject to substantial variability related, among other things, to local weather conditions and cannot be predicted in advance with complete accuracy.
WWW Tide and Current Predictor is the source of the data used here. I am responsible for any errors that may have arisen in the presentation of that data. These current tables are distributed in the hope that they will be useful, but without any warranty; without even the implied warranty of merchantability or fitness for a particular purpose.
| Ebb: Weak to Strong | Flood: Weak to Strong | |||||||||
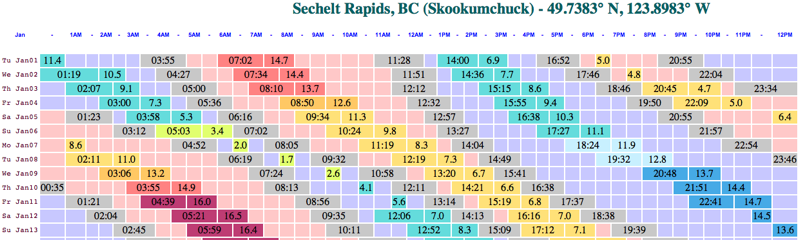
The time of slack water is shown as a time (e.g., 08:23) on a gray background.
Normally, the time and magnitude of maximum ebb and flood are shown together (e.g., 10:34 7.5) on a background color related to the magnitude. Occasionally, there is not room for both. In such cases, only the magnitude is displayed and the position of the text allows you to estimate the actual time.
Below is a sample portion of a current chart. As an example, consider Monday, January 7. At about 1:00 AM there is a flood current of 8.6 (no precise time provided because there is not room on the chart). The next entry is for 04:52 — at this time the current is slack. At about 6:30 AM there is an ebb current of 2.0. Then at 08:05 there is another slack. Flood current starts and maximizes at 11:19 at a value of 8.3 and continues to flood (red) until 14:04, when the current is again slack. The ebb current (blue) begins and reaches a maximum of 11.9 at 18:24. The ebb continues until the slack at 22:54.
Inland Waters of British Columbia and Washington
Ocean Coastline of Vancouver Island & Washington
A Few Other Sites
Feedback
If you have thoughts on how these tables might be improved, please write. I am also interested in any errors you might detect so the site can be corrected.
Are there any sites on the British Columbia or Washington coast for which you would like to see current tables in this format?
Email me with any thoughts