Tidal Current Chart Finder
Current Atlas: San Juan Islands & Strait of Georgia

Canadian Hydrographic Office
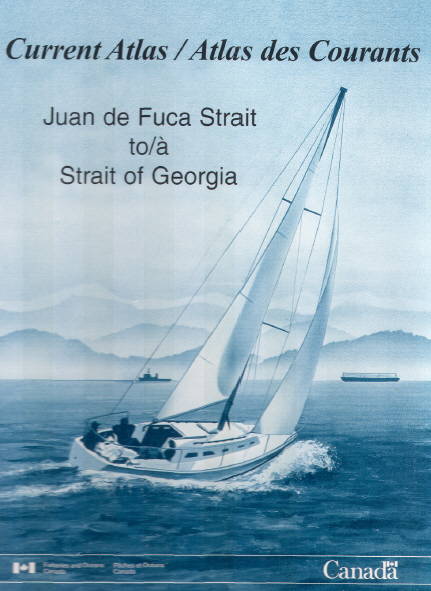
The Canadian Hydrographic Office publishes a 212-page, 8.5″ × 11″, coil-bound book (Current Atlas: Juan de Fuca Strait to Strait of Georgia) that provides charts documenting the state of tidal currents during the various phases of the tide. Armed with the tide tables for Point Atkinson, the user of this atlas can determine the proper chart that applies at any given time. Each chart is identified by a number — (2) in the example above. You need to have access to this book to use the tools described below.
The book includes an algorithm to determine the number of the appropriate chart. This depends on the magnitude of the tidal range, whether the tide is falling or rising, and the time after the last high or low tide. The algorithm, copied from the book, is shown below.
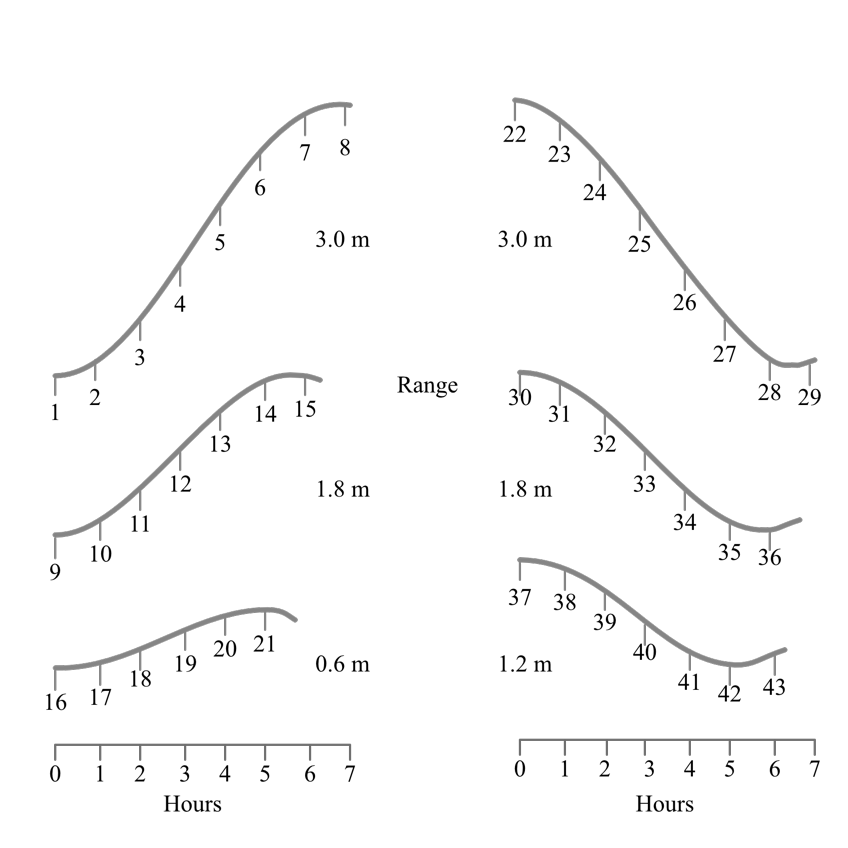
(1) From Point Atkinson predicted tides, extract for the required date and time:
a) The range (high water − low water)
b) Tendency (rising or falling)
c) Time after preceding high (or low) water to the nearest hour
(2) From the graph below, select the curve most appropriate to the results of (1a) and (1b), and select the hourly increment on the curve corresponding to the results of (1c).
(3) The number over the increment selected above is the number of the chart showing the tidal streams for the required time and conditions.
This might seem simple at first glance, but it is tedious in practice. Several attempts have been made to ease this task. The ones I am familiar with are described below.
Washburns (formerly Waggoner’s) Tables
This is a commercial booklet, available for a given calendar year, that shows every hour for every day in that year accompanied by the number of the applicable chart.
Emanuel Borsboom
Mr. Borsboom created a free resource, available both as a downloadable PDF and as HTML online, which also shows every hour of every day and the number of the applicable chart from the current atlas.
Current Atlas Tables — borsboom.io
TinyOctopus
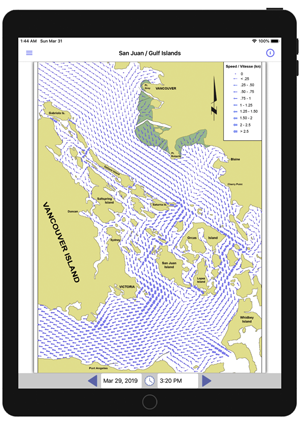
This small company based in Seattle has created an app (PNW Current Atlas) with the charts licensed from the book itself for iPad and Android tablets. This is a further step up in convenience: the user provides the date and time, and the application shows the chart directly. This eliminates the need to look up the chart in the paper atlas. The cost was $20 at the time of writing. Carrying a tablet on a small boat can be problematic, but the app is useful for pre-planning, and it is not too difficult to print selected screenshots at home.
Bearboat
The SanJuanCurrents application, available on this page for free for Macintosh users, shows the same information in a scrollable list.

You might notice that each of these resources occasionally points to a different chart number for a given day and hour. This is due to differences in the computer algorithms each source created from the instructions in the atlas. The instructions are slightly ambiguous. Fortunately, when there is a discrepancy, the charts indicated by the different resources are in fact very similar for any given date and time.
Bearboat Application: SanJuanCurrents
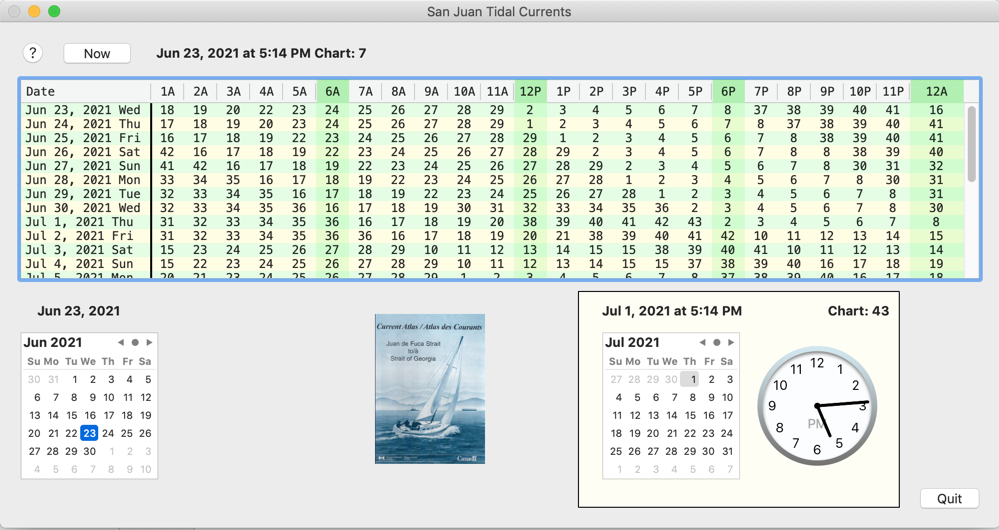
Above is a screenshot of the application. The user can find the applicable chart number for the present time by clicking the Now button. It is also possible to specify a date and time to get the appropriate chart number for any arbitrary moment.
Use the download link in the sidebar to get the application. The program runs on Macintosh computers only. This is a free application that can be used without restriction. The resource must be used with the understanding that errors may have been introduced by the developer. Use it at your own risk.
Feedback
If you have thoughts on how this program might be improved, please write. I am also interested in any errors you might detect so corrections can be implemented.
Email me with any thoughts